Trade conflicts, supply bottlenecks and increased competition are leading to enormous cost pressure on producers worldwide, including warp knitting companies. Only those who use their resources optimally can survive. KM.ON has developed the k.management dashboard to enable manufacturers of warp knitted textiles to fully exploit their potential.
The smart tool uses near-time data from warp knitting machines connected to the KM.ON Cloud via key to provide an overview of key figures, anytime, anywhere. The practical dashboard was launched in 2018. This was followed by continuous optimisations in cooperation with pilot customers, including Filesan.
Up to 15 employees from the Turkish manufacturer of warp knitted net articles – principally designed for agriculture – used the k.management offer for production planning and quality control purposes, while CEO BilginTürkoğlu was also constantly connected to production events. “I saved the link I needed at the time to my Google favourites. The dashboard was running constantly in the background. I checked the figures almost hourly,” explains the Managing Director, who until then had to call the Production Manager for further details every time the machine stopped for a longer period of time. While the dashboard is a useful tool for him, there is still room for improvement based on his feedback.
Input from Filesan and all other pilot customers led to an initial upgrade in March 2021. Further optimisations followed in October 2021. The latest generation dashboard now offers even more transparency in production with new functions, and therefore provides the basis for highly efficient management of all resources and processes. “The machine situation remains unchanged, but customers can act proactively and promptly, by optimising how employees are scheduled for example,” explains Marcel Wenzel, Product Owner at KM.ON. “No one has to routinely check the situation on the machines anymore.”
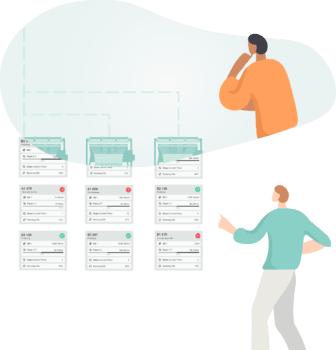
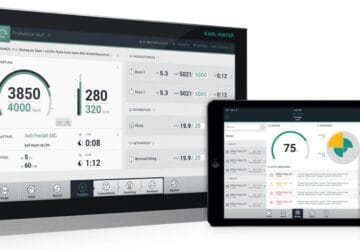
Overview of the operating status of all machines at a glance for production that is as uninterrupted as possible
Detecting problems at a glance: To ensure highly efficient production, manufacturers of warp knitted textiles must avoid unnecessary, costly interruptions. Upcoming steps have to be planned in advance and real-time information has to be provided quickly. This is precisely what the k.management dashboard offers. The tool provides a live overview of all machines that is available anywhere, highlights problems such as machine downtime using easy-to-understand symbols and also suggests the cause. Rapid detection makes efficient intervention possible. This allows customers to optimise their delivery reliability, machine utilisation and machine downtimes, all while maximising yield.
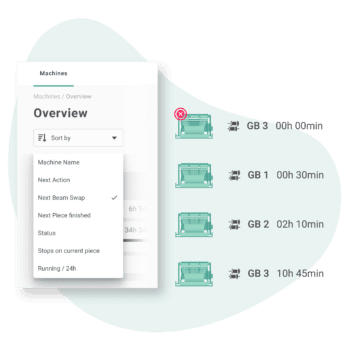
Sorting machines, e.g. according to the next upcoming beam change, for anticipatory deployment planning and minimisation of downtime
Sorting by activity pressure: To maximise machine utilisation and thus profitability and delivery reliability, a special sorting function has also been integrated into the k.management dashboard. The feature shows the next planned machine stops and any unplanned down-time. Planned service interruptions occur, for example, due to beam changes and are sorted based on urgency. Unscheduled stops are triggered by things such as a yarn break, and are immediately recognisable thanks to the machines being ordered and grouped according to status. By providing information about the upcoming measure at an early stage, resources can be used optimally: it is always clear which employee has to look after which machine and when, therefore meaning production runs as efficiently as possible.
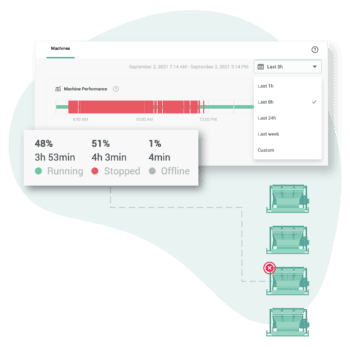
Displaying the machine status history over an observation period as a prerequisite for optimising processes and designing an efficient process at shift changeover
Looking to the past to efficiently plan the future: Another challenge for warp knitting mills is the pressure to optimise their processes. Production processes must be extremely lean and cost-efficient. The k.management dashboard supports this via a function that displays the status history – running, stopped, offline – of each machine to date. When conducting a review, the maximum time span is three months. Based on the chronology, the value-added contribution of each machine can be analysed in detail and compared with other machines to optimise important work processes.
Moreover, shift changes can be facilitated. As part of this process, answers to key questions about what happened during the last shift are handed over as well as the tasks. Features are currently being prepared for this, which relate to the frequency and type of production fault, the cause and time of a machine failure, the duration until machine operation is resumed or the causes of performance differences between machines.


